
A missed refill should show up as a signal, not a surprise. A pharmacy adherence dashboard can bring refill completion, adherence trends, and performance changes into one view so teams can spot gaps earlier. For chronic conditions such as diabetes and hypertension, the standard Proportion of Days Covered (PDC) threshold is 80%.
It’s hard to act on a problem you can’t see until a patient misses a pickup or a target slips. A useful dashboard turns scattered pharmacy data into practical cues: which patients may need follow-up, where refill workflows are stalling, and which measures deserve attention. The examples ahead show how to read adherence and refill indicators, connect them to financial performance, and distinguish a real trend from a single data point. You’ll also see how pharmacy management software can support a clearer, more timely view of daily operations.
Key Takeaways
- Compare adherence trends with refill and workflow data to spot emerging gaps before they become missed pickups.
- Use the 80% PDC threshold as a reference point when reviewing adherence for chronic conditions such as diabetes and hypertension.
- Read clinical measures alongside prescription volume and labor costs to see how performance and workload relate.
- Look for repeat refill delays that may point to missed reminders, authorization holdups, or communication gaps.
- Interpret claims-based adherence carefully, since inpatient medication use can create gaps in pharmacy claims data.
Why is pharmacy performance so hard to track?
Pharmacy performance is difficult to track when refill, dispensing, and staffing data sit in separate reports. A pharmacy adherence dashboard can bring these signals together, helping teams monitor medication trends and spot workflow changes. A daily total rarely explains why a measure moved or which task needs attention.
Compare refill completion by medication, reporting period, and outreach status to understand a change. A dip in one medication group may call for a different response than a broader decline. For example, if delays cluster around prescriptions awaiting authorization, the team has a specific workflow to investigate instead of treating every missed refill alike.
Illustrative root-cause example: A pharmacy sees more prescriptions left uncollected. Staff compare reminder records, authorization status, and pickup details. They find that reminders were sent, but some authorizations remain unresolved. The team can focus follow-up on that process rather than repeating outreach to every patient.
Predictive analytics can help sort records by refill patterns that may signal an interruption. A useful alert should point staff toward a concrete review, such as checking a recent fill or pending task. Custom reports can group results by medication, prescriber, or refill status. Managers can then examine a specific pattern instead of relying on one storewide total.
Which pharmacy adherence dashboard software platforms are available, and how do they compare? Options include reporting within dispensing or pharmacy management systems and separate analytics tools. Compare data sources, report flexibility, outreach workflows, and how easily staff can trace a displayed measure to its underlying records.
What HIPAA, privacy, and security requirements apply to pharmacy adherence dashboards in the United States? The appropriate review depends on the patient information the dashboard handles and how the pharmacy uses it. Map what data appear, who needs access, and how information is handled, then assess those practices against requirements applicable to your organization.
How much do pharmacy adherence dashboard tools cost, and what pricing models are common? Costs depend on the platform, reporting needs, data connections, and implementation scope. Compare proposals by the reports and workflows included, the information sources connected, and any setup or ongoing charges described in the terms.
What features should a pharmacy adherence dashboard include for patient outreach and follow-up? Look for refill status, outreach history, next-step tracking, and filters by medication or patient group. These details can help staff determine whether a record needs a new reminder, internal follow-up, or review of a prescription that remains uncollected.
How can a pharmacy integrate an adherence dashboard with its dispensing system, EHR, or pharmacy management system? Identify which records each report needs, map the relevant fields, and establish when information should refresh. Test a sample report against source records before staff use it to guide outreach or workflow decisions.
What are the limitations and risks of pharmacy adherence dashboards, including data accuracy and patient privacy? Claims may not show medication given during an inpatient stay, and outdated records can distort trends. Review exceptions against source information, and consider data access and handling as part of the pharmacy’s implementation plan.
How should a pharmacy implement an adherence dashboard and train staff to use it? Start with one workflow, such as overdue refill review, and assign an owner. Train staff to interpret statuses, record outreach, and flag recurring data issues for review. A focused rollout helps the team build a consistent routine around the information.
Clinical and financial performance measurement
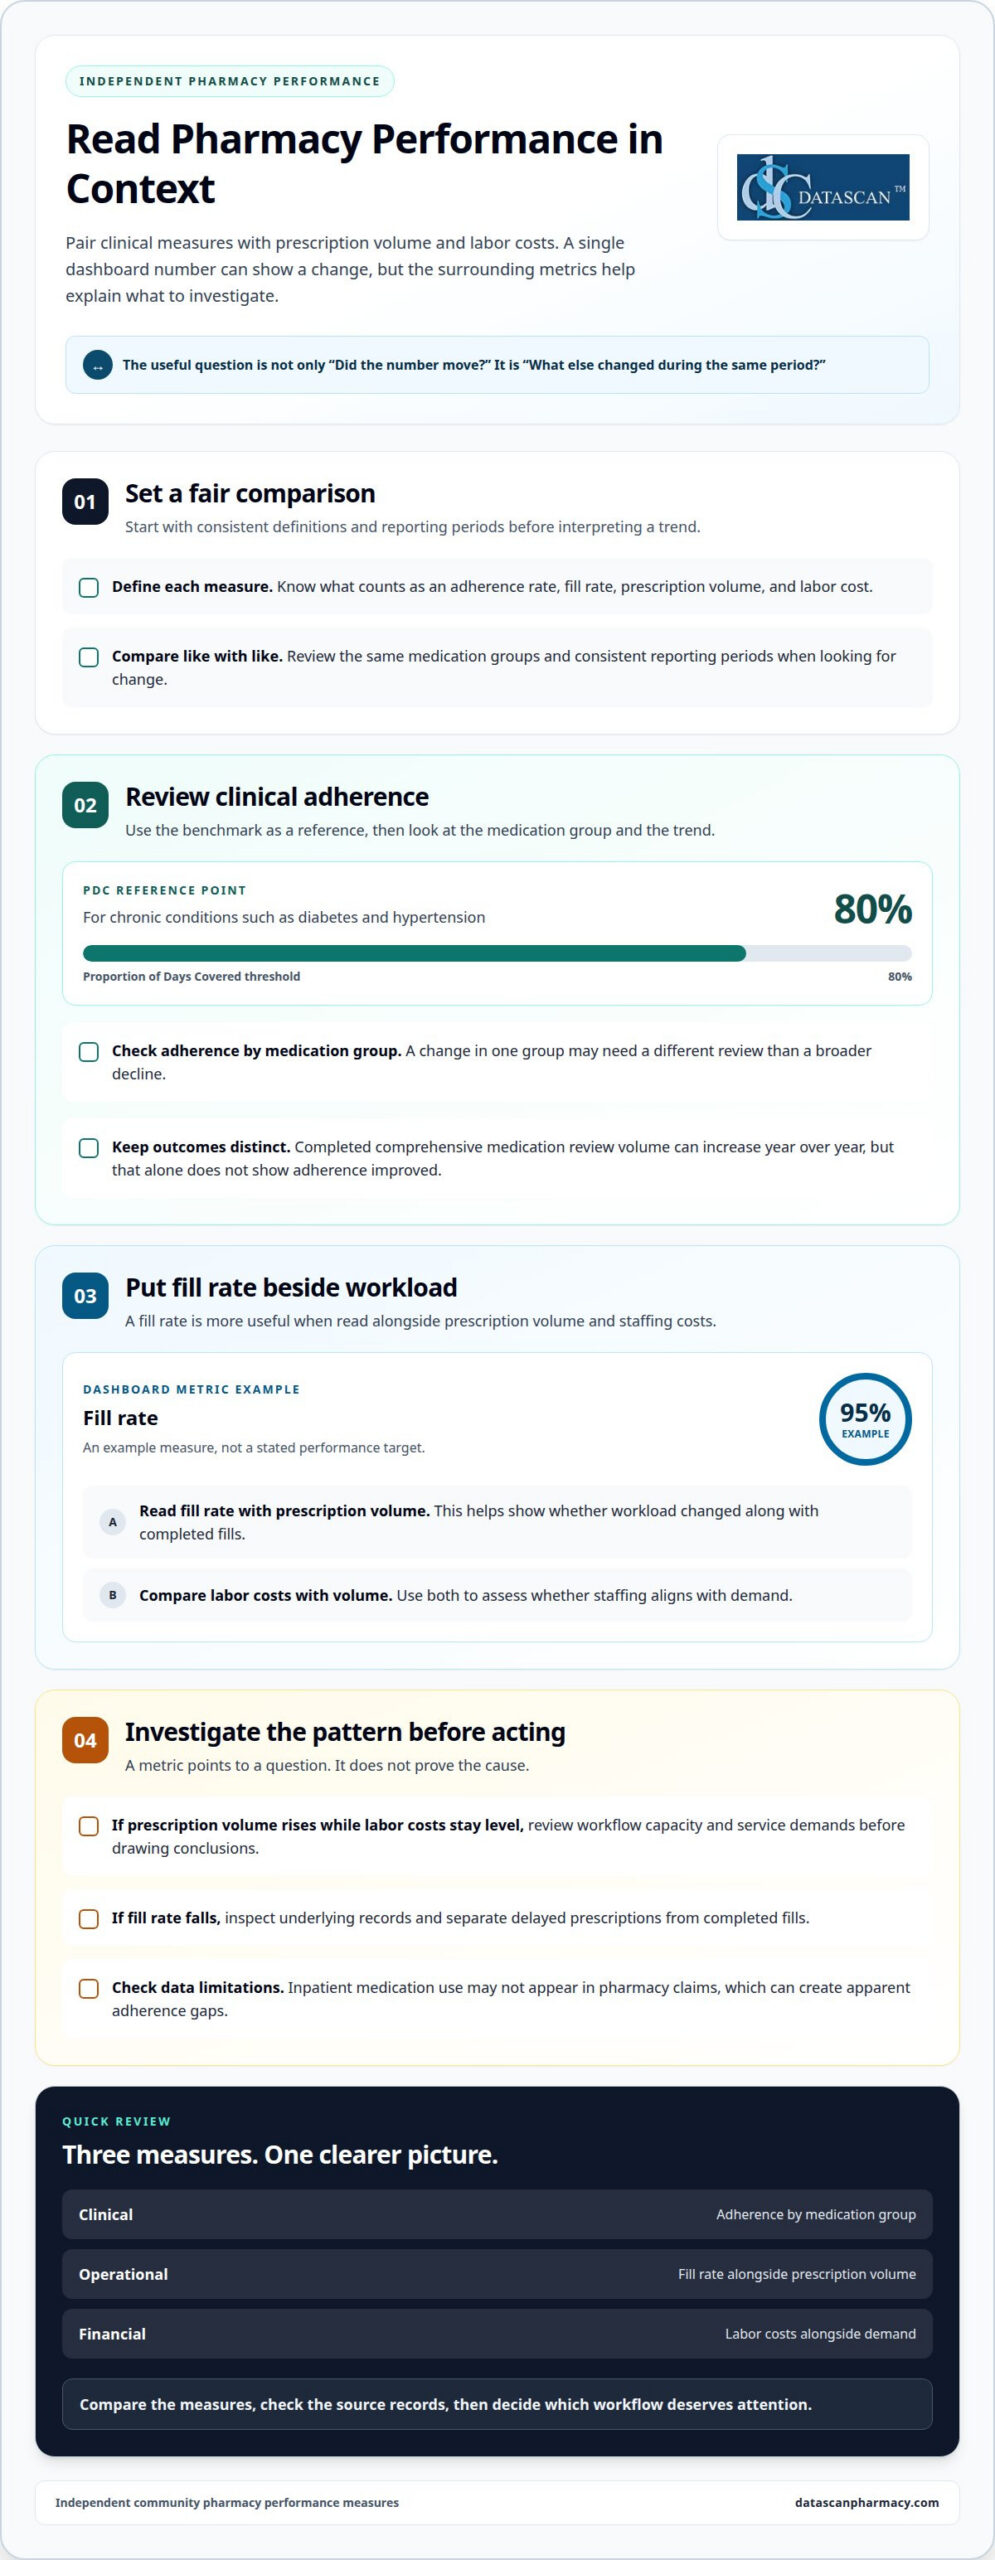
Measure clinical performance and store operations side by side. An adherence rate can show whether patients are staying on therapy, while prescription volume, fill rate, and labor costs show how the pharmacy is handling demand. Read the measures together, then investigate changes before setting a workflow response.
One benchmark example comes from industry performance standards. Across many retail locations, adherence rates for diabetes, cholesterol, and hypertension medications often trend above 80%. A separate industry measure shows completed comprehensive medication review volume can increase significantly year over year. These figures describe different outcomes, so don’t treat review volume as proof of improved adherence.
For a pharmacy-level view, define each metric before comparing periods. A 95% fill rate is one example of a dashboard metric, but the number alone doesn’t explain performance. Pair it with prescription volume and staffing costs to see whether a change reflects workload, labor allocation, or a shift in completed fills.
- Clinical: Review adherence by medication group and compare consistent reporting periods.
- Operational: Track fill rate alongside prescription volume to identify workload changes.
- Financial: Compare labor costs with prescription volume to assess whether staffing aligns with demand.
Keep the comparison useful. If prescription volume rises while labor costs stay level, review workflow capacity and service demands before drawing conclusions. If fill rate falls during the same period, examine the underlying records and distinguish delayed prescriptions from completed fills. Each measure points to a question, not an automatic cause.
Hospital and health system networks offer separate examples of performance targets in clinical settings. Their targets often involve greater than 95% compliance for barcode medication administration across all units. Meeting and exceeding these compliance goals demonstrates how a defined target and repeated measurement can make progress visible.
Use a practical review sequence: choose the measure, set a consistent reporting period, compare results, then inspect records behind a notable change. Keep clinical indicators distinct from financial ones, but review them together during planning. This gives managers a clearer basis for follow-up without treating a single percentage as the full story.
If you’re reviewing how pharmacy technology can support your measurement workflow, talk with the Datascan Pharmacy Software team about your operational needs.
Identifying missed refill and profit opportunities
Refill completion data can reveal where patients drop out of the refill process. Track completed, delayed, and uncollected prescriptions separately. Then compare those outcomes with reminder history, authorization status, and communication notes. This makes it easier to identify whether a gap begins with a missed reminder, a delayed authorization, or a handoff that never reached the patient. A single total can hide these differences.
Use a consistent review routine. Filter the refill report by medication, status, and outreach activity, then inspect the records behind unusual changes. Manual review still matters: a dashboard can flag a pattern, but staff need to understand what happened in each case. Record the reason for follow-up so the next review can distinguish recurring workflow issues from isolated interruptions.
Illustrative case: A pharmacy notices several prescriptions marked ready but not picked up. Staff review each record and find that some patients received reminders, while others have no documented contact. The team assigns follow-up by status and records the result. This separates a communication gap from a patient who was contacted but could not collect the medication.
Pharmacy and primary care teams can also review refill data across care settings. A primary care organization may work with pharmacists to identify patients who repeatedly fail to pick up refills. The team can then direct support toward those patients instead of sending the same general message to everyone. Useful dashboard fields include:
- Refill completion and pickup status
- Reminder and follow-up history
- Authorization delays and unresolved communication
- Medication groups with repeated interruptions
Refill patterns can inform inventory decisions, but they need careful interpretation. Inventory turnover helps identify medications that remain on the shelf longer than expected. Shrinkage can point to losses involving waste, expired products, or dispensing errors. Review both measures with purchasing and dispensing records before changing stock levels. A slow-moving item may reflect a demand shift, while shrinkage calls for a different investigation.
Illustrative inventory case: A medication shows lower turnover than expected, while refill records show fewer completed prescriptions. The manager checks recent demand, shelf quantities, and expiry dates before adjusting orders. If the inventory report instead shows unexplained shrinkage, the next step is to examine waste and dispensing records. Different signals require different actions.
To connect refill activity with financial performance, review the same reporting period across completed fills, inventory movement, and labor activity. Look for recurring patterns, not one unusual day. A dashboard helps prioritize the next question; staff review establishes the cause. This distinction keeps outreach focused on patient outcomes and inventory decisions grounded in pharmacy records.
Proportion of Days Covered (PDC) threshold
Proportion of Days Covered (PDC) measures the percentage of days a patient has access to medication, using pharmacy claims. For chronic conditions such as diabetes and hypertension, the standard threshold is 80%. A dashboard can show which patient records fall below that mark and help staff prioritize a closer review.
Think of PDC as a time-based measure, not a prescription count. A patient with several claims may still have uncovered days between fills. Reviewing the proportion of covered days helps teams spot gaps that a simple volume report could miss. Medication Possession Ratio (MPR) is another measure pharmacies can use to assess whether patients continue therapy as prescribed. Keep each measure clearly labeled so staff understand what its result represents.
Health plans and accountable care organizations use PDC to quantify how consistently patients fill medication regimens on time. A dashboard can organize patient-level results by medication or adherence status, then help staff create a focused follow-up list. The measure points to a possible access gap, but it doesn’t explain why that gap occurred.
Illustrative case: A pharmacy reviews a diabetes medication report and finds a patient below the 80% threshold. Staff check the fill timeline and outreach notes, then contact the patient to understand the interruption. If the patient reports difficulty obtaining a refill, the team can address that specific barrier and document the next step. The dashboard identifies whom to review; the conversation informs the response.
How can pharmacies use adherence dashboards to improve Star Ratings and medication adherence measures? Use PDC results to identify patients who may need refill follow-up, then document outreach and review changes over time. This supports focused adherence work, but a dashboard alone doesn’t determine a plan’s Star Rating.
What medication adherence dashboard programs, incentives, or requirements vary by U.S. state or payer? Measures, reporting processes, and incentive arrangements can differ by payer and program. Pharmacies should read each applicable measure definition and reporting workflow, then configure their review process around those criteria.
Interpret PDC with care. A claims record may show no pharmacy fill during a period when the patient received medication during a hospital stay. The dashboard may therefore show an apparent gap that doesn’t reflect the patient’s full access to medication. Staff should review the surrounding claims and care context before treating a low result as a confirmed interruption.
- Check the measure: Confirm the medication group and reporting period displayed.
- Review the record: Compare claims with refill history and relevant care transitions.
- Act and document: Record the outreach outcome and next follow-up step.
Used this way, PDC turns a percentage into a practical review queue. The pharmacy sees which records need attention, while staff establish the context behind each result.
How do pharmacy adherence dashboards calculate adherence rates and identify at-risk patients?
Dashboards commonly use Proportion of Days Covered (PDC) to summarize medication access across a measurement period. PDC uses pharmacy claims to estimate the percentage of days a patient has medication available. The result helps teams find records for review, but the claims behind each result matter.
To interpret a PDC figure, start with the medication and time period included in its calculation. Then review the patient’s claim history for fills and potential gaps. Health plans and accountable care organizations use PDC to quantify how consistently patients fill medication regimens on time. A pharmacy can use the same type of measure to organize follow-up.
A flag should guide investigation, not replace it. Check whether the patient’s refill pattern changed, whether a claim is missing, and whether the patient needs outreach. A claims gap can occur when a patient is hospitalized and receives medication during inpatient care. In that situation, pharmacy claims may not show the full medication picture.
- Confirm the measure: Identify the medication and reporting period behind the displayed rate.
- Review claims: Look for fills, gaps, and records that may need context.
- Prioritize follow-up: Sort flagged records by medication or refill status.
- Document the result: Record outreach and the next action in the patient’s record.
Illustrative case: A patient’s diabetes medication record shows an apparent gap. Staff review the claim history and see a hospital admission during that period. They account for the inpatient context before interpreting the dashboard flag. The result is a more informed review, rather than treating a claims gap as a confirmed missed refill.
At-risk lists become more useful when teams pair the adherence measure with relevant refill details. For example, a record with a recent delay and no documented outreach may need a different response than one with an inpatient claim gap. Filters by medication and status help staff focus their review. Clear labels also help prevent different measures from being mistaken for one another.
Use a repeatable review process. First, set the medication group and reporting period. Next, sort flagged records by the reason for review. Then compare claims with refill and outreach history, noting any inpatient context. Finally, document the finding and assign a follow-up step. This turns a rate into a practical workflow without assuming every flag has the same cause.
Want to connect adherence reporting with pharmacy operations? Discuss your pharmacy workflow with Datascan.
Datascan Pharmacy Software: Datascan Pharmacy Management Software
Datascan Pharmacy Software offers Datascan Pharmacy Management Software for independent community pharmacies looking to coordinate daily operations and refine their workflows. When adherence reviews reveal that refill processes need closer attention, its customizable workflow engine can organize pharmacy tasks around the way your team works.
Medication synchronization and e-care plans are among the software’s features, giving pharmacies tools to support medication-related workflows. Datascan Point of Sale (POS), MobileScripts Patient Mobile App, and Datascan Mobile Delivery App are also available as part of its pharmacy technology offerings. Choose the tools that fit the operational issue you’re addressing, rather than expecting software alone to explain every adherence gap.
Contact Datascan Pharmacy Software to discuss your pharmacy’s workflow needs.
Turn adherence insights into a practical next step
A pharmacy adherence dashboard is most useful when its findings lead to a clear decision. Choose one workflow your team wants to improve, decide who reviews the relevant information, and agree how staff will record the next action. A focused process gives your team room to learn from the data without adding a complicated routine to an already full day.
Pharmacy technology can support different parts of that work. Datascan Pharmacy Management Software supports pharmacy operations, while Datascan Point of Sale (POS) and the MobileScripts Patient Mobile App provide additional tools for the pharmacy and patient experience. The right starting point depends on the workflow you want to strengthen.
Take the next step by discussing your pharmacy’s operational priorities with Datascan Pharmacy Software. Contact Datascan Pharmacy Software to talk through where pharmacy management software may fit your goals. Your team can build from a clear priority, a manageable process, and a better view of the work ahead.
Frequently Asked Questions
How can pharmacies stop reacting to problems after they happen?
Set up a routine that surfaces exceptions before staff begin their regular tasks. For example, assign a team member to review overdue refill records at opening, then route each item to the person responsible for follow-up. Use a shared status such as “contacted,” “authorization pending,” or “resolved” so the next shift sees what remains. Review recurring unresolved items during staff huddles and adjust the workflow causing the backlog.
What are pharmacy KPIs?
Pharmacy KPIs, or key performance indicators, are measures used to assess specific clinical or operational goals. A pharmacy might track refill completion to monitor follow-through, prescription volume to understand workload, or inventory turnover to review stock movement. Each KPI needs a clear definition, a reporting period, and an owner who can act on the result. Without those details, staff may interpret the same measure differently.
Which Metrics Deserve a Place on Your Dashboard?
Choose measures that connect to decisions your team can make. A dashboard might group patient-care measures, refill workflow indicators, and store operations separately, then show who is responsible for each review. Avoid adding a metric just because the system can display it. For instance, pair a refill status with a documented next action, so the team knows whether to contact a patient, resolve an internal task, or close the record.
Why is pharmacy analytics important?
Pharmacy analytics helps teams distinguish a recurring pattern from a one-off event. Compare equivalent reporting periods and review the records behind a change before adjusting staffing, outreach, or ordering. For example, a short-term rise in uncollected prescriptions may reflect a temporary workflow issue rather than a lasting shift in patient behavior. Segmenting results by medication or status can help managers identify where investigation will be most useful.
What is a pharmacy medication adherence dashboard?
A pharmacy adherence dashboard is a reporting view that organizes medication-related measures and patient records for review. It can help a team prioritize follow-up, document outreach, and monitor whether workflow changes affect the measures being tracked. For example, staff might filter a worklist by refill status, assign an owner, and record the result. The dashboard supports decisions, while pharmacy staff interpret each record’s context.
Which adherence metrics should a pharmacy dashboard track, such as PDC and MPR?
For practical comparisons, label each report with its measure definition, eligible medication list, observation period, and data cutoff. Keep payer or program reports separate unless their criteria align, so staff don’t compare incompatible totals. Assign a reviewer to note exceptions and questions that arise during report review. Those notes give the team a consistent reference when interpreting later reports or updating its internal reporting process.
Which pharmacy adherence dashboard software platforms are available, and how do they compare?
Options include reporting within dispensing or pharmacy management systems and separate analytics tools. Compare data sources, report flexibility, outreach workflows, and how easily staff can trace measures to their underlying records.
What HIPAA, privacy, and security requirements apply to pharmacy adherence dashboards in the United States?
Map what patient data the dashboard displays, who needs access, and how information is handled. Assess those practices against the requirements applicable to your organization.

Article by
Sarah Callioras
Sarah Callioras is Vice President at Datascan Pharmacy Software, bringing nearly 25 years of experience across independent pharmacy operations and pharmacy technology. Since joining Datascan in 2016, she has played a key role in driving business growth, strengthening client relationships, and supporting independent pharmacies through innovative software solutions. With a strong background in pharmacy operations, business development, and strategic leadership, Sarah is passionate about helping independent pharmacies succeed in an evolving healthcare landscape.
 Kevin Minassian is the President of Datascan Software. Under his leadership, the company rapidly expanded to provide pharmacy management software on a national level. Over the last 15+ years, he has ensured that Datascan has continuously evolved to offer innovative solutions for independent pharmacies while still offering world-class customer support. He is passionate about helping independent pharmacies to remain competitive, achieve success, and offer the very best service to their communities.