
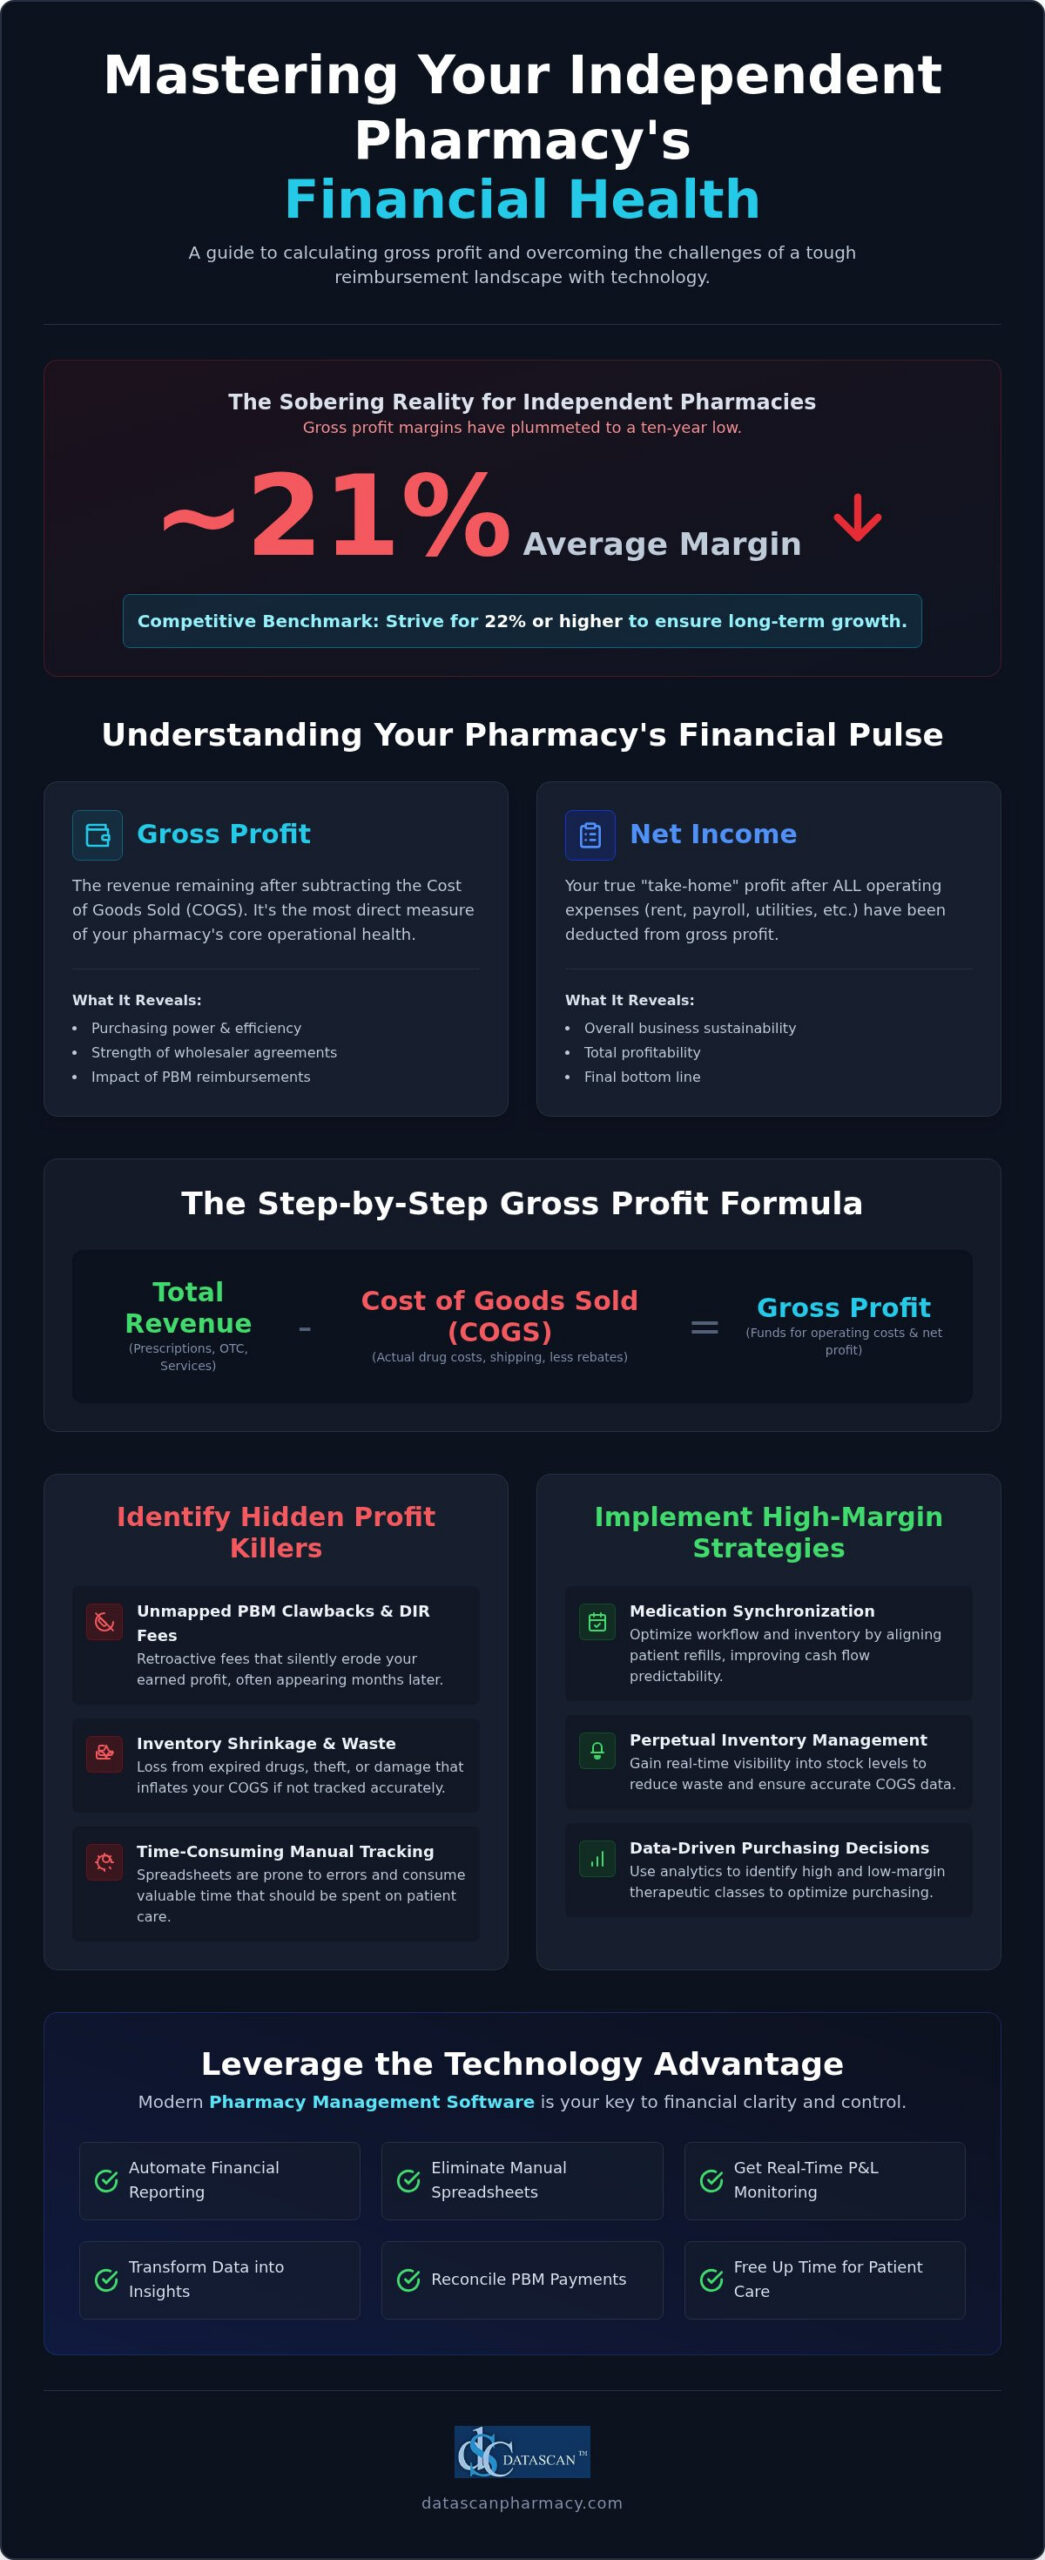
Did you know that in 2026, independent pharmacy gross profit margins have plummeted to a ten-year low of approximately 21%? It’s a sobering reality that reflects the tightening grip of PBM underpayments and the administrative burden of reconciling inventory costs. Mastering how to calculate pharmacy gross profit with precision is no longer optional; it’s a survival requirement for the modern owner. You likely feel the pressure of shrinking returns every time you review your books, wondering where the disconnect lies between your hard work and your bottom line. We understand that fighting for every cent against massive corporations is exhausting, especially when you’re trying to prioritize patient care.
This guide empowers you to take back control by mastering the essential formulas required to navigate the current reimbursement landscape. You’ll discover how the right pharmacy software can automate these complex calculations and free you from manual spreadsheet management. We’ll explore 2026 industry benchmarks, reveal where profit often leaks from your workflow, and show you how specialized pharmacy management software transforms financial tracking into a competitive advantage. It’s time to move beyond survival and start optimizing your independent pharmacy for long-term growth.
Key Takeaways
- Master the fundamental distinction between gross profit and net income to ensure you are tracking the true operational health of your independent pharmacy.
- Learn exactly how to calculate pharmacy gross profit by reconciling total revenue against your actual cost of goods sold while accounting for complex PBM clawbacks.
- Identify the hidden “profit killers” in your workflow, such as unmapped DIR fees and inventory shrinkage, that often go unnoticed without real-time monitoring.
- Discover how to utilize pharmacy management software to automate financial reporting and eliminate the time-consuming burden of manual spreadsheet tracking.
- Implement high-margin strategies like medication synchronization and perpetual inventory management to optimize cash flow and protect your bottom line in a challenging reimbursement climate.
Understanding Pharmacy Gross Profit vs. Net Income
Success in the independent pharmacy space isn’t just about the volume of scripts crossing your counter; it’s about the precision of your margins. Many owners confuse high revenue with high performance, but without a clear grasp of What is Gross Profit, you’re essentially flying blind. Gross profit represents the revenue left over after you’ve subtracted your Cost of Goods Sold (COGS). It’s the most raw indicator of your purchasing power and dispensing efficiency. Net income, conversely, is your actual “take-home” profit after every single operational expense, including rent, payroll, and utilities, has been deducted.
Distinguishing between these two is vital. While net income tells you if your business is sustainable, gross profit tells you if your inventory management and PBM contracts are actually working for you. If you don’t know how to calculate pharmacy gross profit accurately, you might miss the fact that while your store is busy, your margins are being cannibalized by poor wholesaler terms or unfavorable PBM reimbursements. We believe independent owners deserve the same level of financial clarity as the big box chains, and that starts with isolating your COGS from your overhead.
Why Gross Profit is the Pulse of Your Independent Pharmacy
Think of gross profit as the early warning system for your business health. It directly reflects the strength of your purchasing agreements and your ability to manage high-cost specialty drugs versus generic alternatives. In an era where PBMs are aggressively shrinking margins, focusing solely on top-line revenue is a dangerous trap. By monitoring your GP regularly, you can identify which therapeutic classes are driving growth and which are costing you money to dispense. High-performing pharmacy management software makes this visibility possible, allowing you to pivot before a low-margin trend becomes a financial crisis. It’s about transforming raw data into a roadmap for better purchasing decisions that protect your bottom line.
Cost of Goods Sold (COGS) in the Pharmacy Context
Calculating your COGS is more than just looking at a wholesaler invoice. For a retail pharmacy, COGS includes the actual cost of prescriptions, over-the-counter inventory, and even the shipping fees associated with procurement. A common pitfall is failing to account for wholesaler rebates or off-invoice discounts, which can significantly skew your results. If your COGS is inflated, your profit reports will look grimmer than reality; if it’s underreported, you’ll face a nasty surprise at tax time. Accurate tracking requires a system that reconciles what you paid with what you actually sold. Understanding these nuances is the first step in learning how to calculate pharmacy gross profit like a seasoned financial expert rather than a distracted business owner. By mastering your COGS, you empower your pharmacy to thrive even when reimbursements are under fire.
The Step-by-Step Formula for Calculating Pharmacy Gross Profit
Execution begins with accurate data collection. To understand your financial standing, you must first aggregate two primary figures: your Total Sales Revenue and your Total Cost of Goods Sold (COGS) for a defined period. Revenue includes all income from prescriptions, clinical services, and front-end sales, while COGS encompasses the actual price paid for that inventory. Once you have these numbers, the basic equation is straightforward. Gross Profit = Total Revenue – COGS. This figure represents the dollars available to cover your operating expenses and, eventually, your net profit. Implementing robust pharmacy software is the most reliable way to ensure these figures are captured in real-time without manual errors.
While the dollar amount is important, it doesn’t tell the whole story of your operational efficiency. In 2026, the average gross profit margin for independent pharmacies has hit a decade low of approximately 21%. To remain competitive, you need to look at pharmacy profit margin benchmarks and strive for a margin of 22% or higher. Understanding how to calculate pharmacy gross profit allows you to see if your purchasing strategies are actually keeping pace with PBM reimbursement shifts. If your margin is dipping below these benchmarks, it’s a clear signal that your workflow or wholesaler agreements require immediate attention.
Calculating Gross Profit Margin Percentage
Converting your profit into a percentage is the most effective way to track performance over time. The math is simple: divide your Gross Profit by your Total Revenue, then multiply by 100. For example, if your pharmacy generated $1,000,000 in revenue with $790,000 in COGS, your gross profit is $210,000, resulting in a 21% margin. This percentage is far more useful than a flat dollar amount because it allows for objective year-over-year comparisons, regardless of fluctuating sales volumes. For retail success in 2026, independent pharmacies should target a gross margin of at least 22% to ensure long-term viability in a landscape defined by PBM volatility.
Markup vs. Margin: Don’t Confuse the Two
Relying on markup alone is a common trap that can hide serious profitability issues. Markup is the percentage added to the cost to reach a selling price, whereas margin is the percentage of the selling price that is profit. If you buy a product for $80 and sell it for $100, your markup is 25%, but your margin is only 20%. Confusing these two numbers often leads owners to believe they’re making more money than they actually are. To convert markup to margin, divide the markup by (1 + markup). Utilizing advanced pharmacy management software helps automate these conversions, ensuring your pricing strategies reflect actual profit goals. If you’re ready to see how your current margins stack up, reach out to our team for a personalized workflow assessment.
Factoring in PBM Reimbursements and DIR Fees
The basic math of revenue minus COGS is a starting point, but it doesn’t reflect the harsh reality of the modern reimbursement environment. If you’re only looking at the initial adjudication screen, you’re missing the hidden profit killers that PBMs bake into their contracts. Understanding how to calculate pharmacy gross profit in 2026 requires a “net-net” approach that accounts for the massive gap between what you’re promised and what actually hits your bank account. You must reconcile every PBM payment against your actual claims to identify underpaid scripts and reconcile your inventory costs with real-world revenue. Without this granular level of detail, your financial statements are merely an estimate rather than a reflection of your business health.
Effective reconciliation is the only way to expose where your margins are being cannibalized. Many independent owners find that their pharmacy management software is their strongest weapon in this fight, providing the data needed to challenge unfair clawbacks. By tracking your “net-net” profit, you move beyond the surface-level numbers and gain a true understanding of your operational viability. It’s about empowering your pharmacy to survive and thrive despite the predatory practices of middleman organizations.
Navigating the PBM Reimbursement Maze
Low reimbursement rates on generic drugs can decimate your gross profit margin if you aren’t paying close attention. The Consolidated Appropriations Act (CAA) of 2026, signed into law on February 3, 2026, marks a pivotal shift in PBM oversight by designating them as “covered service providers” under ERISA. This change subjects them to stricter compensation disclosure rules, but it hasn’t stopped the trend of aggressive underpayments. You need a system that identifies claims paid below cost in real-time, allowing you to flag and appeal these transactions immediately. Utilizing advanced workflow software helps you catch these discrepancies before they become a permanent drain on your resources.
DIR Fees: The Retroactive Profit Drain
DIR fees remain a significant challenge even with recent regulatory shifts. While 2024 changes moved many fees to the point of sale, the complexity of retroactive adjustments still forces pharmacies to estimate and set aside funds for potential clawbacks. The 2026 regulatory environment continues to evolve, making it essential to use pharmacy software that can forecast your true profit after all anticipated fees are deducted. For a comprehensive approach to managing pharmacy DIR fees in this new environment, you need a data-driven defense that goes beyond manual spreadsheets and embraces real-time reconciliation. This forecasting capability transforms your financial planning from guesswork into a precise science, ensuring you have the cash flow necessary to maintain operations. We believe that transparency is the key to independence, and your technology should provide a clear window into your future profitability.
Strategies to Improve Your Pharmacy’s Profit Margins
Knowing how to calculate pharmacy gross profit is only the first half of the battle; the second half is actively engineering those numbers to trend upward. In a climate where independent margins have hit a ten-year low, relying on volume alone is a failing strategy. You need to transform your workflow into a profit-generating engine. We believe that by leveraging specialized pharmacy management software, you can reclaim the time and capital currently lost to operational friction. It’s about empowering your team to focus on high-value tasks rather than manual data entry.
Implementing a perpetual inventory system is one of the most immediate ways to boost your bottom line. When your pharmacy software tracks every unit in real-time, it prevents the overstocking that traps your cash on the shelf. This capital can then be reinvested into higher-margin areas like compounding or clinical services. By using compounding pharmacy software, you can capture specialized prescription volume that is far less susceptible to PBM underpayments. These specialized services allow you to provide unique value to your community while protecting your business from the “race to the bottom” in generic reimbursement.
Inventory Management and Purchasing Efficiency
Purchasing efficiency is about more than just finding the lowest price; it’s about timing and precision. Overstocking doesn’t just tie up funds; it increases the risk of carrying dead stock that eventually expires and becomes a total loss. Your pharmacy management software should provide automated reports that flag slow-moving items before they become a liability. Additionally, utilizing secondary wholesalers for high-volume generics can significantly lower your COGS, provided you have the data to prove the savings. These small adjustments in purchasing strategy often yield the most significant improvements in your overall gross profit percentage without requiring a single new patient.
Revenue Diversification and Clinical Services
Diversifying your income is essential for long-term survival in the current market. Clinical services such as immunizations and Medication Therapy Management (MTM) offer significantly higher margins than standard dispensing because they aren’t as heavily impacted by PBM clawbacks. To support these services, you must streamline your standard workflow to free up your staff’s time. You can learn more about our electronic delivery system to see how optimizing your logistics improves patient retention and captures more front-end sales. A modern pharmacy software suite also integrates with patient-facing mobile apps to drive refill adherence and high-margin retail traffic. Pairing these tools with proven pharmacy patient retention strategies ensures that the patients you serve today remain loyal, high-value customers for years to come. If you’re ready to modernize your workflow and protect your margins, contact our team today for a custom technology consultation.
Leveraging Pharmacy Management Software to Automate Profit Tracking
Manual spreadsheets are a liability in the high-stakes environment of 2026. Relying on hand-entered data to track your margins is not just time-consuming; it’s a recipe for catastrophic oversight in a landscape where PBMs constantly shift the goalposts. When you move beyond the limitations of paper and generic digital tools, you gain the ability to see your pharmacy’s financial health with total clarity. We believe that modern pharmacy management software should serve as your most trusted financial advisor, providing the real-time insights you need to protect your independence. By automating the data collection process, you eliminate human error and ensure that your understanding of how to calculate pharmacy gross profit is based on actual bank deposits rather than optimistic estimates.
The true power of automation lies in the reconciliation process. Reclaiming lost revenue from PBMs is an impossible task for a human to manage script-by-script, but it’s a core competency of a high-performance pharmacy software system. When your dispensing data is fully integrated with your financial reporting, you can identify discrepancies immediately and take action. Integrating your pharmacy POS with your management system creates a total financial view, capturing every cent from both the pharmacy counter and the front-end retail section. This unified perspective is vital for identifying where profit is being lost in your daily workflow and where you can optimize for better returns. Independent owners who want to eliminate these administrative bottlenecks entirely should explore how pharmacy workflow optimization software can automate PBM compliance and restore profitability in 2026.
The Power of Integrated Business Intelligence
Business intelligence dashboards transform raw numbers into actionable strategies. Instead of digging through reports, you can visualize profit trends by day, week, or even specific therapeutic categories at a glance. This high-level visibility allows you to identify “red flag” prescriptions that are losing money instantly, giving you the chance to adjust your purchasing or clinical focus before the end of the month. Pharmacy business intelligence dashboards give independent owners the real-time visibility needed to stop PBM underpayments from silently draining their margins. You can discover the features of our pharmacy management software to see how these visual tools empower owners to make faster, smarter business decisions. It’s about having the pulse of your pharmacy right at your fingertips.
Choosing the Best Software for Retail Pharmacy Growth
Not all systems are created equal when it comes to safeguarding your bottom line. When evaluating technology, look for key features like integrated PBM reconciliation, automated medication synchronization, and robust, customizable reporting. We believe that U.S.-based support is vital for resolving the complex financial discrepancies that often arise with wholesaler and insurance billing. You need a partner who understands the local market and can offer immediate assistance when your margins are on the line. To ensure your front-end is performing as well as your back-end, you should explore our pharmacy POS system for a seamless, total-store financial tracking solution. Choosing the right technology is the most important investment you’ll make in your pharmacy’s future.
Future-Proof Your Pharmacy’s Financial Health
Mastering the mechanics of how to calculate pharmacy gross profit is the first step in reclaiming your store’s independence. In a 2026 market defined by shrinking margins and aggressive PBM clawbacks, you can’t afford to rely on manual spreadsheets or generic data. By integrating real-time PBM reconciliation and advanced business intelligence, you transform your financial statements into a strategic roadmap for growth.
Datascan has been family-owned and operated since 1981, standing as a dedicated ally to community pharmacies. Our pharmacy management software provides the precision you need with U.S.-based support and innovative features like med-sync and e-care plans included. You have the power to turn operational burdens into streamlined successes. It’s time to stop letting “hidden” profit killers drain your resources and start leveraging pharmacy software that works as hard as you do.
Frequently Asked Questions
What is a good gross profit margin for an independent pharmacy in 2026?
A gross profit margin of 22% or higher is generally considered the benchmark for a healthy independent pharmacy in 2026. With the industry average hitting a 10-year low of approximately 21%, maintaining this threshold is essential for long-term sustainability. Achieving this requires a precise understanding of how to calculate pharmacy gross profit while proactively managing your inventory costs. Monitoring these benchmarks allows you to identify if your purchasing agreements are keeping pace with market shifts.
How do DIR fees affect the calculation of my pharmacy’s gross profit?
DIR fees and retroactive clawbacks act as hidden profit killers that directly reduce your “net-net” profitability. Even with regulatory shifts moving many fees to the point of sale, you must still account for adjustments that happen after the initial adjudication. If you don’t reconcile these fees against your monthly financial statements, your reported gross profit will be artificially inflated. Modern pharmacy management software is vital for forecasting these retroactive drains to ensure your cash flow remains stable. Learn more about managing pharmacy DIR fees with a data-driven 2026 strategy to protect your independent profitability.
Can pharmacy management software calculate gross profit automatically?
Yes, advanced pharmacy management software can automate this entire process by integrating your dispensing data with your cost of goods sold. Instead of manual spreadsheet entry, these systems provide real-time business intelligence dashboards that visualize your margins instantly. This automation allows you to see exactly where profit is being lost in your workflow. By utilizing integrated tools, you reclaim the time needed to focus on patient care while ensuring your financial data is always accurate.
What is the difference between gross profit and gross margin?
Gross profit is the raw dollar amount remaining after you subtract the total cost of goods sold from your total revenue. Gross margin, however, is that profit expressed as a percentage of your total revenue. While both metrics are important, gross margin is often the more useful figure for comparing your performance against industry benchmarks or tracking year-over-year efficiency. Knowing how to calculate pharmacy gross profit in both formats ensures you have a complete picture of your business.
How often should I calculate my pharmacy’s gross profit?
You should ideally monitor your gross profit in real-time or on a weekly basis using an integrated dashboard. Waiting until the end of the month to review your financials often means it’s too late to address PBM underpayments or inventory inefficiencies. Frequent tracking allows you to catch “red flag” prescriptions that are losing money immediately. Consistent oversight ensures that you can make data-driven decisions to protect your margins before they impact your pharmacy’s overall health.
How can I improve my pharmacy’s gross profit without raising prices?
You can improve your margins by optimizing inventory through a perpetual inventory system and expanding into high-margin clinical services like immunizations or compounding. Implementing medication synchronization also streamlines labor and improves adherence revenue without increasing your front-end prices. Utilizing pharmacy software to identify slow-moving “dead stock” helps reduce carrying costs and frees up vital cash flow. These strategies allow you to increase profitability by focusing on operational efficiency and revenue diversification rather than pricing.
What are the biggest expenses that impact pharmacy gross profit?
The primary expense impacting your gross profit is the Cost of Goods Sold (COGS), which includes the price of prescriptions and retail inventory. PBM-related costs, such as DIR fees and underpaid claims, also significantly reduce your real-world margins. It’s important to remember that operating expenses like rent, payroll, and utilities impact your net income but do not factor into the gross profit calculation. Focusing on reducing your COGS is the most direct way to improve your bottom line.
Is it better to track profit by individual prescription or by total store volume?
It is essential to track both to maintain a truly profitable operation. Total store volume provides a high-level view of your business health, but individual prescription tracking is the only way to identify specific claims paid below cost. High-performance pharmacy software allows you to flag these underpaid scripts in real-time, enabling you to appeal unfair reimbursements immediately. This granular approach ensures that no single transaction is cannibalizing the profits generated by your high-volume dispensing.
 Kevin Minassian is the President of Datascan Software. Under his leadership, the company rapidly expanded to provide pharmacy management software on a national level. Over the last 15+ years, he has ensured that Datascan has continuously evolved to offer innovative solutions for independent pharmacies while still offering world-class customer support. He is passionate about helping independent pharmacies to remain competitive, achieve success, and offer the very best service to their communities.