

Pharmacy BI Dashboards: Guide for Independent OwnersSeptember 2, 2026
Independent pharmacies are losing thousands of dollars every month to opaque PBM reimbursements and predatory DIR fees that they simply don’t have the time to track manually. Pharmacy business intelligence dashboards solve this by transforming your raw prescription data into immediate, actionable insights that highlight underpaid claims and protect your bottom line. By integrating these tools directly into your pharmacy management software, you can stop guessing about your margins and start making data-driven decisions that ensure your store’s survival in an increasingly hostile market.
You’ve likely felt the frustration of watching your hard-earned profits vanish into the “black box” of PBM spread pricing and clawbacks. We understand that as a community pharmacist, your focus should be on patient care, not spending hours buried in complex spreadsheets. In this guide, you’ll learn how to leverage advanced pharmacy software to automate claim identification and gain real-time visibility into your profitability. We’ll walk through the essential KPIs every owner needs to monitor and show you how streamlined workflows can finally free up your schedule to grow your business.
Key Takeaways
- Discover how pharmacy business intelligence dashboards convert complex prescription data into visual charts that expose profit leaks in real time.
- Identify the critical KPIs, including gross profit at the point of sale and inventory turnover, that directly impact your pharmacy’s financial health.
- Learn how to proactively flag underpaid PBM claims by automatically comparing reimbursements against your actual acquisition costs to protect your margins.
- Evaluate why integrated reporting within your pharmacy management software is superior to cumbersome third-party add-ons for saving time and reducing overhead.
- Streamline your workflow to reclaim hours spent on manual reporting, allowing you to focus on high-margin services and patient care.
What are pharmacy business intelligence dashboards and why do independent owners need them?
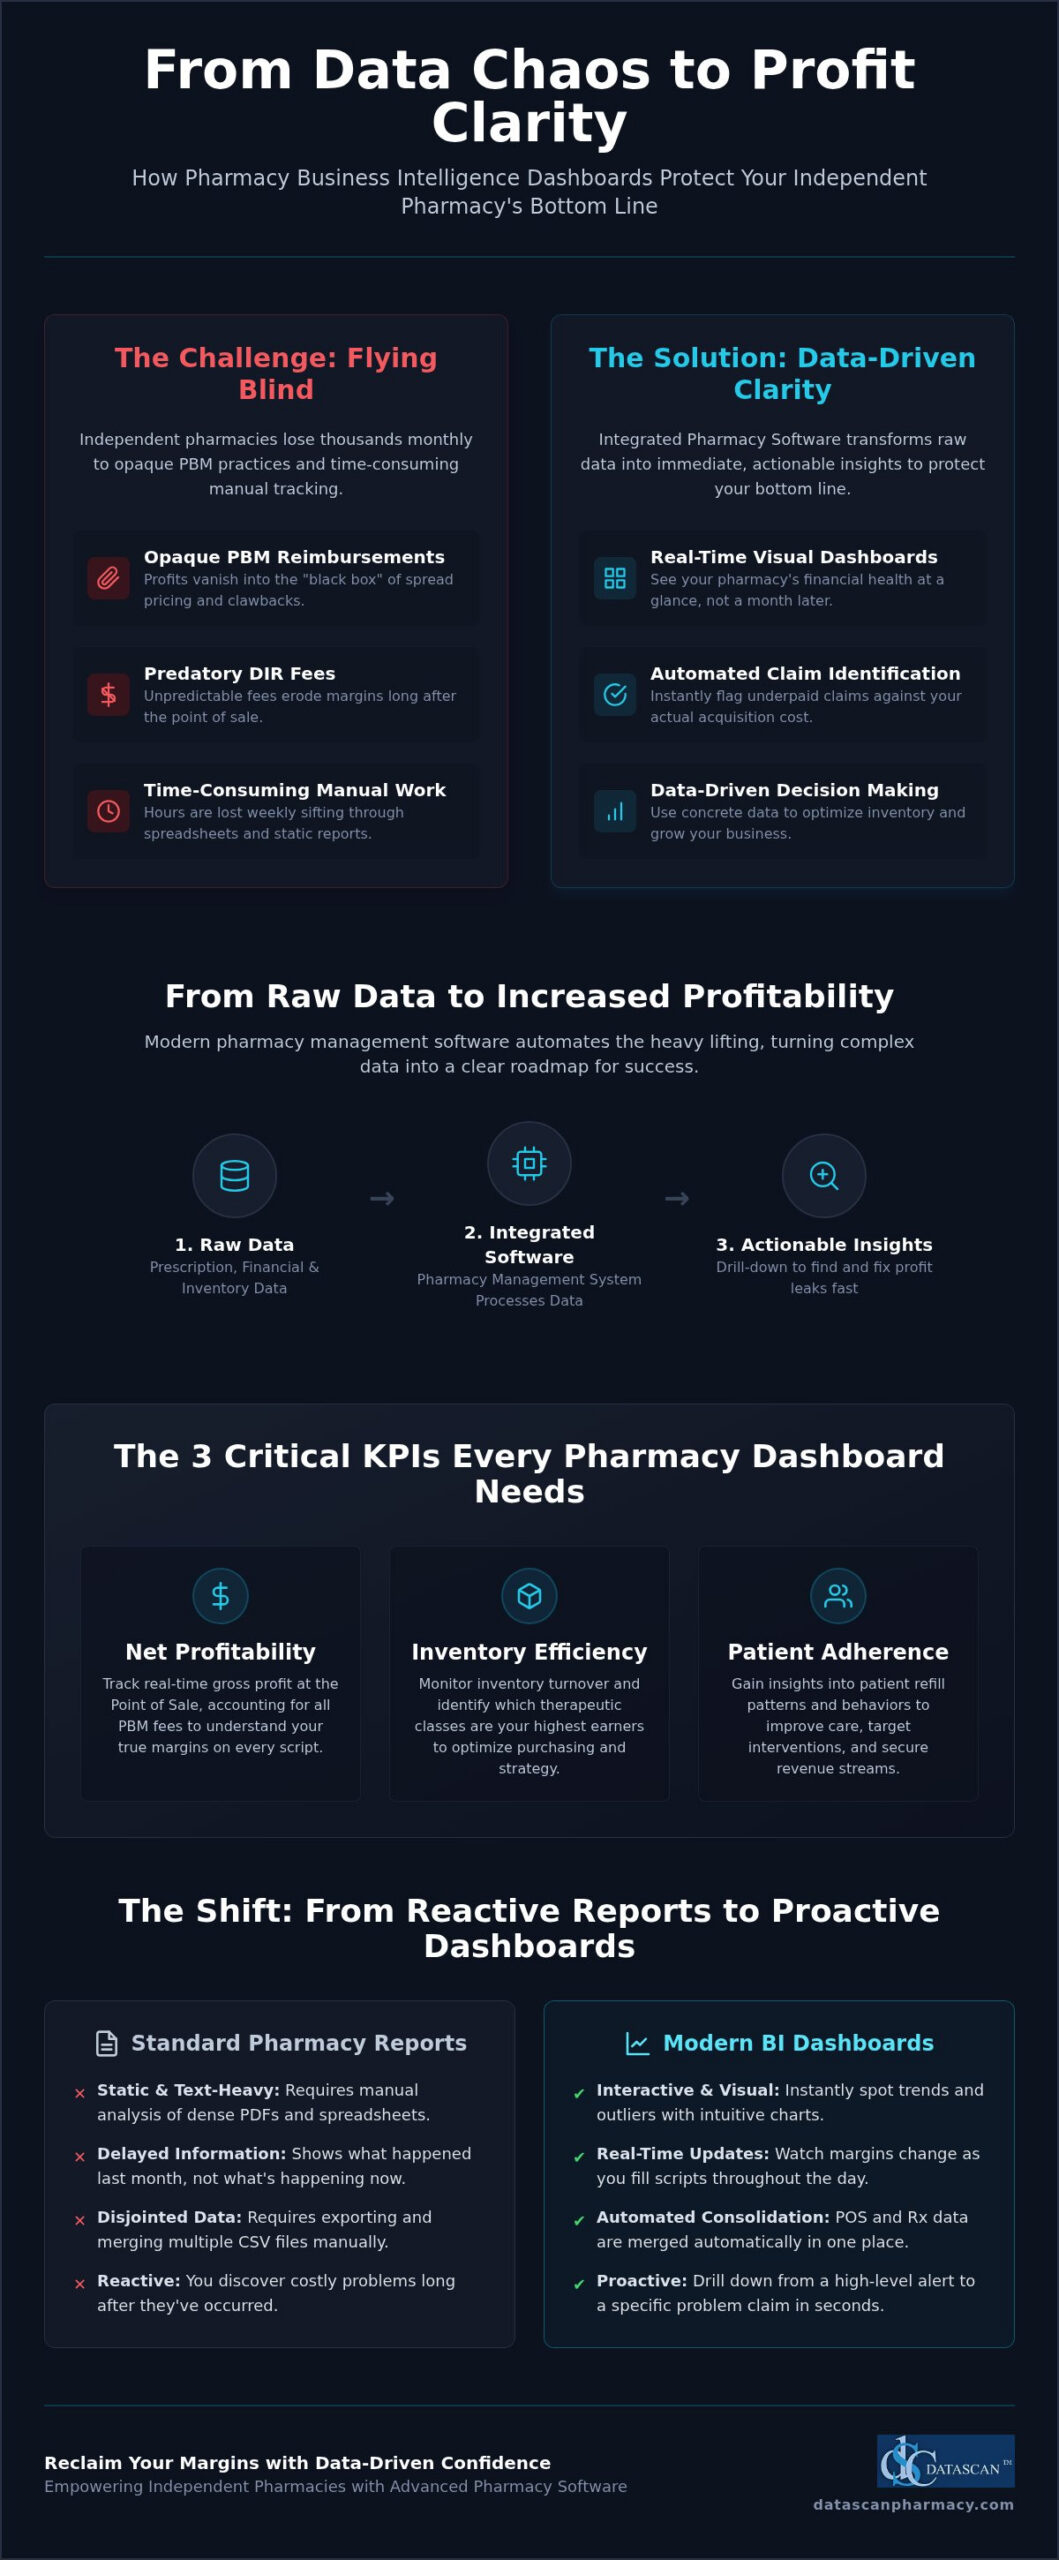
Pharmacy business intelligence dashboards are visual reporting tools that consolidate prescription, financial, and inventory data into real-time charts to help owners identify profit leaks. Instead of sifting through dozens of disjointed reports, you get a unified view of your store’s health at a single glance. This technology represents a fundamental shift from “looking at what happened” to “seeing what is happening now.” For independent owners, this visibility is the difference between catching a negative margin claim today and discovering a thousand dollar loss during next month’s reconciliation.
The concept of Business intelligence has historically been reserved for large retail chains with dedicated analyst teams. However, modern pharmacy management software now brings these sophisticated tools to the community level. Without real-time data, independent pharmacies operate at a severe disadvantage. You’re essentially flying blind while PBMs use advanced algorithms to squeeze your reimbursements. BI simplifies complex data sets into intuitive visuals, ensuring that even non-technical owners can spot trends without needing a degree in data science.
How do dashboards differ from standard pharmacy reports?
Standard pharmacy reports are often static, text-heavy PDFs that require manual analysis to find useful information. If you’re still relying on manual spreadsheet entries, you’re losing hours of valuable time every week. Dashboards offer interactive, real-time visualizations that allow you to drill down from a high-level overview directly into a specific problematic claim. This interactivity transforms your data from a record of the past into a roadmap for the future.
- Interactive Drill-Down: Click a “red flag” on your chart to see the exact NDC and PBM responsible.
- Real-Time Updates: Watch your margins shift as you fill prescriptions throughout the day rather than waiting for month-end.
- Automated Consolidation: Stop exporting CSV files; let your software do the heavy lifting by merging POS and Rx data automatically.
Why is data-driven decision making critical in 2026?
The pharmacy industry reached a tipping point in 2026. With the overall pharmacy trend seeing double-digit cost increases and PBMs managing over 90% of claims, guessing isn’t an option. You need to know your exact cost-to-dispense at all times to survive. When you use technology to automate the “business” side of the business, you reclaim the time needed for high-margin clinical services and direct patient care. Real-time visibility isn’t just a luxury; it’s a survival mechanism that empowers you to stand your ground against reimbursement pressure.
What are the most important KPIs for a pharmacy dashboard?
Effective pharmacy business intelligence dashboards focus on the “Big Three” metrics: net profitability, inventory efficiency, and patient adherence. A dashboard is only as good as the metrics it tracks, and for the independent owner, these data points represent the difference between a thriving business and one struggling to keep the lights on. By consolidating this information into a single view, you can stop guessing about your store’s health and start making decisions based on cold, hard facts.
How do you track pharmacy profit margins effectively?
Monitoring your net profit requires looking past the initial reimbursement to account for PBM take-backs and DIR fees. In 2026, branded drug prices have seen a median increase of approximately 4%, which means your margins are under constant pressure. Your dashboard should provide real-time gross profit tracking at the Datascan Point of Sale, allowing you to see exactly what you’re making on every transaction before the patient leaves the counter.
You also need the ability to identify which therapeutic classes are your highest earners. If specialized medications or specific generics are driving your bottom line, you need to know so you can adjust your inventory and marketing strategies accordingly. Learning how to calculate pharmacy gross profit accurately in this new regulatory environment is the first step toward reclaiming your agency as an owner. If you’re ready to see these insights in action, you can schedule a demo with our team to explore our integrated reporting tools.
Which operational metrics save the most time?
Operational KPIs are designed to help you run a leaner, more efficient business. One of the most impactful metrics is prescription volume by hour. By visualizing when your store is busiest, you can optimize staffing levels to ensure you aren’t overstaffed during lulls or overwhelmed during rushes. This data-driven approach to scheduling directly reduces labor waste and improves the patient experience.
- Med-Sync Enrollment: Track your medication synchronization progress to move prescriptions to predictable pick-up dates, which smooths out your customizable workflow.
- Inventory Turn Rates: Identify “dead stock” that is sitting on your shelves and tying up valuable capital that could be reinvested into growth.
- Delivery Efficiency: Monitor driver performance and delivery turnaround times to ensure your off-site patients are receiving the same level of care as those in-store.
Focusing on patient adherence rates is equally critical. With Star Ratings directly impacting your reimbursement levels and network access, using pharmacy business intelligence dashboards to flag non-adherent patients allows your staff to intervene before it affects your scores. This proactive management turns your data into a tool for both better clinical outcomes and higher pharmacy profitability.
How can dashboards help you identify underpaid pharmacy claims?
Automated claim flags prevent financial loss by instantly identifying every transaction where the reimbursement falls below your actual acquisition cost. Pharmacy Benefit Managers (PBMs) often rely on the fact that independent owners don’t have the bandwidth to audit thousands of individual claims manually. By utilizing pharmacy business intelligence dashboards, you turn the tables. These tools act as a 24/7 digital auditor, flagging reimbursements that fall below the Wholesale Acquisition Cost (WAC) to ensure you aren’t paying for the “privilege” of dispensing medication to your community.
The “Red Flag” system is a critical component of modern pharmacy management software. It automates the detection of claims with negative margins, allowing your staff to address issues at the moment of dispensing rather than discovering them weeks later. This level of precision simplifies the reconciliation of PBM payments and third-party aging, transforming a once-arduous task into a streamlined, manageable workflow. When your software does the heavy lifting, you reclaim the time needed to focus on patient outcomes and business growth.
How do you combat PBM reimbursement issues with data?
Combatting PBMs requires more than just anecdotes; it requires aggregated data that proves patterns of underpayment over time. In an environment where the top ten PBMs managed over 90% of total prescription claims volume in 2025, your data is your only real leverage. Dashboards allow you to visualize the cumulative impact of DIR fees on your monthly cash flow with a single chart, providing a clear picture of your actual net earnings. For a comprehensive look at navigating these challenges, explore our guide on managing pharmacy DIR fees.
What is the “Bottom Line Up Front” for claim auditing?
Automated claim flags prevent financial loss by catching negative margin scripts before they’re even dispensed. While many systems offer end-of-month reporting, real-time integration with your Datascan Point of Sale is superior because it stops the bleeding immediately. There’s a significant difference between estimated and actual reimbursement tracking; dashboards bridge that gap by pulling in electronic remittance advice (ERA) to show you exactly what was paid versus what was promised. This transparency is essential for maintaining a healthy bottom line in the face of aggressive PBM oversight and shrinking margins.
The best pharmacy management software should empower you with integrated pharmacy business intelligence dashboards that don’t require expensive third-party add-ons or complex manual exports. You shouldn’t have to be a data scientist to run your business; you need a system that lets you see your pharmacy’s health in under 60 seconds. While some systems force you to wait for overnight data refreshes, the most effective tools provide real-time updates that reflect your current inventory and sales. Whether you’re checking margins from the pharmacy counter or reviewing performance from home via mobile access, your data must be accessible and easy to interpret at a glance.
Customization is also vital because every independent pharmacy is unique. If you specialize in compounding or nursing home modules, your reporting needs differ significantly from a standard retail operation. Your reporting tools should allow you to build views that matter to your specific niche rather than forcing you into a one-size-fits-all template. This flexibility ensures you’re tracking the right variables for your specific business model, which is essential for long-term sustainability. If you’re tired of fighting with generic reports that don’t show the full picture, it’s time to request a personalized walk-through of an integrated solution.
Why is US-based pharmacy software support important for BI?
US-based pharmacy software support is a non-negotiable requirement for accurate business intelligence. Pharmacy data in the United States is uniquely complex due to the intricate relationships between PBMs, wholesalers, and state regulations. You need support staff who understand the nuances of the US healthcare system to help you fix data discrepancies before they impact your tax filings or audits. Fast response times from a domestic team ensure that technical glitches don’t leave you flying blind during critical decision-making periods.
What questions should you ask a pharmacy software vendor about data?
When evaluating pharmacy business intelligence dashboards, you need to dig into the specifics of how the vendor handles your information. Don’t settle for vague promises; ask direct questions to ensure the tool actually serves your needs as an independent owner.
- Is the BI dashboard included in the base price or is it a separate fee? Many vendors hide these costs in “pro” tiers or monthly add-on subscriptions.
- Does the data update in real-time or on a delay? Decisions made on yesterday’s data can be costly in a fast-moving market.
- Can I export my data if I need to work with an outside accountant? Ownership of your data includes the ability to move it into other formats for professional financial analysis.
A vendor that is transparent about these points is likely a partner that values your independence. By choosing a system that prioritizes ease of use and real-time visibility, you’re investing in a tool that protects your margins while freeing up your time to focus on what matters most: your patients.
How does Datascan transform your raw data into increased profitability?
Datascan transforms your raw data into increased profitability by providing integrated, real-time pharmacy business intelligence dashboards that expose PBM underpayments and automate complex operational reporting. By merging data from your workflow software and Datascan point of sale, we offer a 360-degree view of your business that corporate analysts can’t replicate. Our tools are designed specifically for the independent owner. We ensure that chain-level technology is delivered with the personal accountability of a family-owned partner that has championed the independent pharmacy since 1981.
Our dashboards specifically target the lack of transparency in PBM reimbursements. While competitors often push external tools that require tedious manual exports, Datascan builds these capabilities directly into your pharmacy management software. This native integration ensures that your data is always accurate and current. You don’t need additional software subscriptions or technical expertise to protect your bottom line. We give you the leverage to fight back against aggressive PBM oversight with facts, not guesses. To understand the full scope of how purpose-built technology can help, our detailed breakdown of software to identify underpaid pharmacy claims walks through exactly how real-time adjudication catches revenue losses at the point of dispensing.
Real-time profitability tracking with Datascan
Profitability tracking shouldn’t be a post-mortem exercise. With Datascan, you see your gross profit on every script before it ever leaves the pharmacy counter. This immediate visibility allows you to flag low-margin claims and inventory anomalies as they happen. You can also track patient engagement through the MobileScripts patient app. You’ll see exactly how digital refills and adherence notifications are impacting your revenue. Automated alerts ensure that you never miss a reimbursement discrepancy. This protects your margins against shrinking spreads and predatory clawbacks. Pairing this real-time profitability data with strong pharmacy accounts receivable management ensures that the revenue you earn is actually collected and reflected in your cash flow.
Freeing up your time to run your business
Technology is most valuable when it gives you back your time. Our automated dashboards typically eliminate 5 to 10 hours of manual reporting per week. This removes the burden of spreadsheet management from your shoulders. Instead of crunching numbers, you can use our data to identify which clinical services, such as e-care plans or specialized med-sync programs, are actually worth your time and resources. This strategic shift allows you to move from a survival mindset to one of growth and optimization. Ready to see your data in a new light? Schedule a Datascan demo today to discover how our pharmacy business intelligence dashboards can secure your store’s future.
Reclaim Your Margins with Data-Driven Confidence
Navigating the complexities of PBM reimbursements and shrinking margins requires more than just hard work; it demands the right technology. By implementing pharmacy business intelligence dashboards, you transition from reactive reporting to proactive management. You’ve seen how real-time visibility into your “Big Three” KPIs, profit, inventory, and adherence, can stop financial leaks before they impact your cash flow.
Datascan has been family-owned and operated since 1981, providing the expert guidance and 100% US-based technical support you need to thrive. Our innovative features, like integrated med-sync and e-care plans, are built into our pharmacy software to ensure your store remains a pillar of the community. Don’t let opaque PBM practices dictate your success. It’s time to empower your independent pharmacy with Datascan’s advanced BI dashboards. We’re here to help you turn raw data into a roadmap for sustainable growth. Your store deserves a partner that fights as hard for your independence as you do.
Frequently Asked Questions
How much does a pharmacy business intelligence dashboard cost?
Costs vary depending on whether the reporting tool is built into your system or requires a third-party subscription. Many vendors charge additional monthly fees for advanced data visualization tiers. Datascan includes robust business intelligence features within our standard pharmacy software licensing to ensure independent owners have the tools they need without hidden overhead. You should always ask if reporting is included in your base price to avoid unexpected costs that eat into your margins.
Do I need a data analyst to use a pharmacy dashboard?
No, you don’t need a specialized analyst to interpret your data when using intuitive pharmacy business intelligence dashboards. Modern systems translate complex financial and prescription metrics into simple visual charts that any owner can understand. This allows you to spot profit leaks and reimbursement trends in seconds. The goal is to provide actionable insights that empower you to make business decisions without requiring a background in data science or accounting.
Can a dashboard help me reduce my DIR fees?
Yes, dashboards help you manage DIR fees by providing visibility into your net profitability on every claim. While you can’t always stop the fees themselves, you can use data to identify high-fee categories and adjust your inventory or clinical focus. By tracking these expenses in real-time, you can predict cash flow more accurately and implement strategies like medication synchronization to improve the metrics that PBMs use to calculate these clawbacks.
How often does the data in a pharmacy BI dashboard update?
The best systems update in real-time to reflect every transaction at the point of sale. Some older pharmacy management software relies on overnight data refreshes, which can leave you making decisions based on outdated information. Real-time updates ensure that if a PBM underpays a claim today, you see the red flag immediately. This allows your staff to address margin issues before the patient even leaves the counter, protecting your daily revenue.
Is my pharmacy data secure in a BI dashboard?
Data security is a top priority, and your information is protected by industry-standard encryption and local access controls. Since our software is not cloud-based, your sensitive business and patient data remains on your local servers under your direct control. We implement rigorous security protocols to ensure that your financial reports and patient records are only accessible to authorized personnel, maintaining full HIPAA compliance while providing the visibility you need to run your store.
Can I track multiple pharmacy locations in one dashboard?
Yes, you can consolidate data from multiple stores into a single, unified view. This “enterprise” visibility is essential for owners who manage several locations but can’t be in two places at once. You can compare performance across your entire organization, identifying which stores are hitting their margin targets and which ones need operational adjustments. This high-level overview helps you standardize best practices and optimize staffing across your entire independent pharmacy group.
What is the best pharmacy management software for data reporting?
The best pharmacy management software is one that provides integrated, real-time business intelligence without requiring third-party exports. Datascan is a top choice because we’ve been family-owned since 1981 and build our tools specifically for the needs of independent owners. Our system combines Rx dispensing, point of sale, and workflow data into one dashboard. This gives you a total view of your profitability and helps you combat predatory PBM reimbursement practices with ease.
How do dashboards improve my pharmacy’s Star Rating?
Dashboards improve Star Ratings by flagging non-adherent patients and tracking medication synchronization enrollment. When you can see exactly which patients are falling behind on their refills, your staff can proactively reach out to improve adherence. These metrics are a primary factor in how PBMs calculate your performance scores. Using pharmacy business intelligence dashboards to drive clinical interventions ensures better patient outcomes and protects your pharmacy from performance-based reimbursement reductions.